In a two-hundred-person company the "when do I get promoted?" conversation happens roughly once a quarter and starts from scratch every time. The manager has a feeling, the employee has a different one, and instead of discussing criteria they discuss wording. A month later two people in the same role turn out to have been told different things, and it stops being a career conversation and becomes a fairness conversation.
Grades turn that into a table two people can read together. Not a score, not an appraisal — a list of concrete requirements: what the next level asks for, and what has already been confirmed.
The grade table
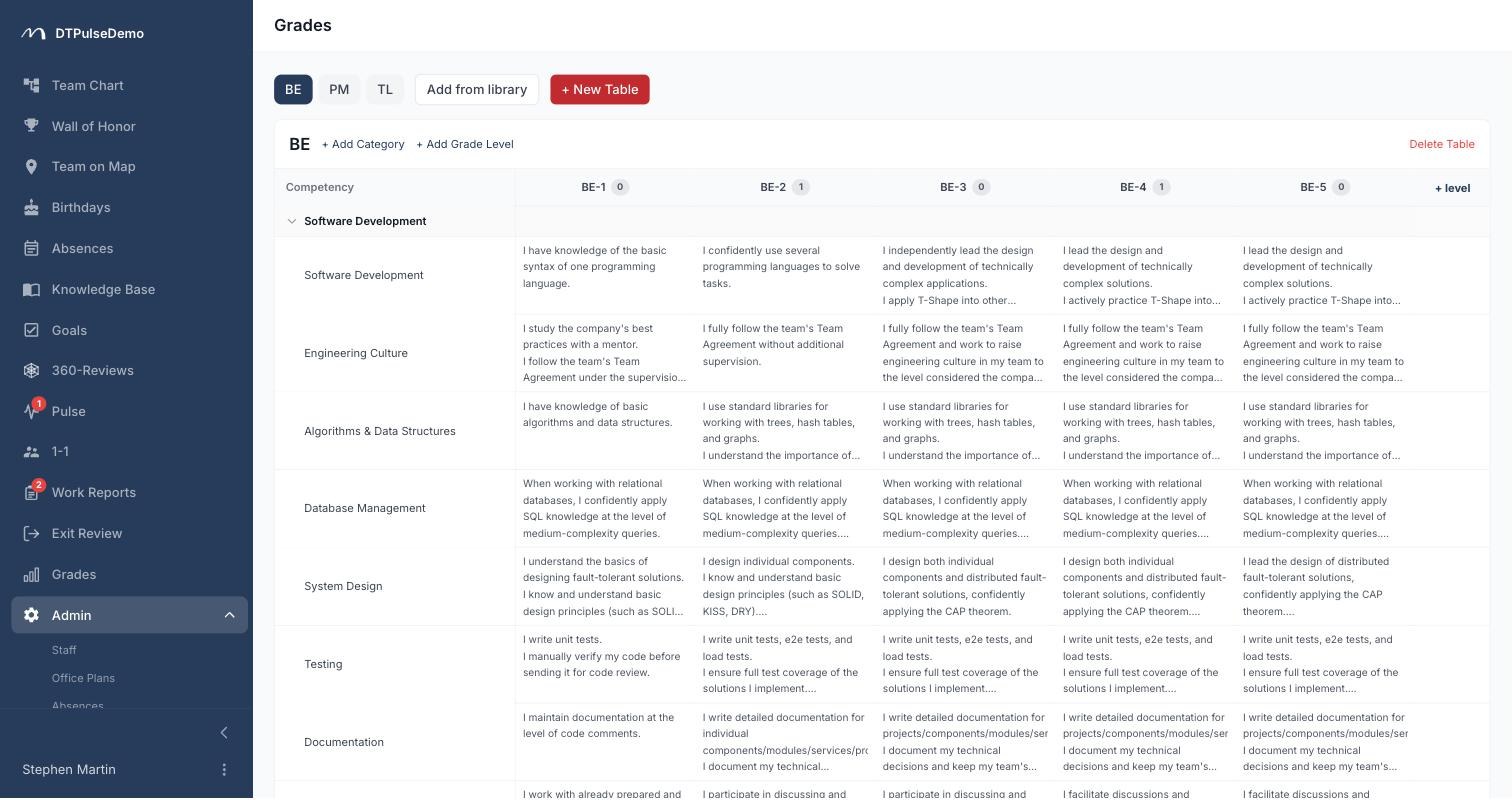
A table is created per role or track — SWE, QA, product, finance, sales; as many tables as you have ladders. Horizontally it runs levels in order of seniority: SWE-1, SWE-2, SWE-3 and so on. Vertically, a competency tree: a category ("Software development", "Communication", "Leadership"), the specific competencies under it ("Code review", "Architecture design"), and a further level of nesting if you want one.
Where a competency meets a level there's a cell with the requirement written out. That cell is what makes a grade discussable: "Senior" stops being a title and becomes two dozen sentences, each of which can be checked.
Two checkboxes instead of one score
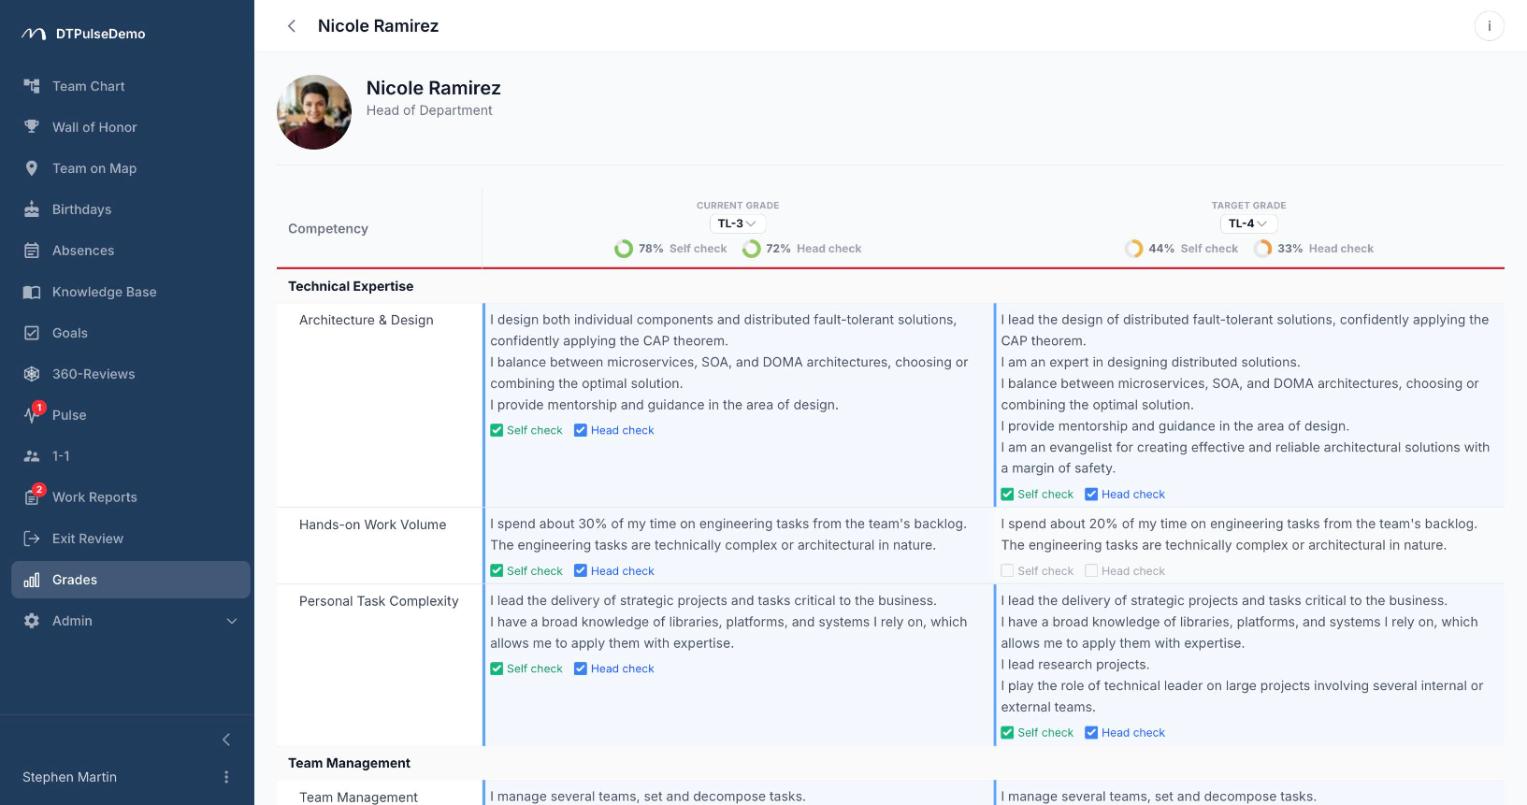
Each employee gets two grades: current and target. Setting the current one auto-fills the target with the next level in the same table — but only when no target had been chosen; an existing target is never overwritten.
Every requirement then carries two independent checkboxes. Self-check can only be ticked by the employee: it's their claim that the requirement is met. Head-check can only be ticked by their direct manager or the head of their department: it's the confirmation. HR and admins tick nothing at all — they manage tables and assign grades and see the result, but the confirmation stays on the real reporting line.
The gap between the two columns is the most useful thing this section produces. It doesn't show who is right; it shows where expectations diverged, and it shows it before the annual review rather than instead of it.
What the tree shows
The Grades section opens on your own card: current and target level, and under each a pair of self / head percentages coloured red through green. The percentage is simply the share of that level's requirements ticked, so "62 / 40" reads without a legend.
Below it sits the whole company tree with two extra columns — Current grade and Target grade — and a jump button at the end of every row. For HR and admins both columns are dropdowns: you can re-grade anyone straight from the tree without opening their profile. Everyone else sees the level names.
An employee with no reports doesn't get a picker they can't use — their own matrix opens directly, or a prompt to talk to their manager if no grades are assigned yet.
Who can see what
An employee's matrix is visible to: themselves; admins and HR across the whole company; and any manager in their management chain, resolved across all four channels the portal uses to describe reporting lines — direct manager, manually assigned additional managers, department leadership, and leadership inherited from a parent department.
The rule is enforced in three places — the page plus the two endpoints that return grades and checks — so a pasted URL or a direct API call doesn't route around it.
The data survives reshuffles
Checks are stored per (employee, requirement), not per (employee, grade). Taking someone off a level clears their current grade and leaves the ticks alone. Put them back on that level six months later and the whole picture returns by itself — no reset, no manual migration. Editing the table behaves the same way: rewording a requirement doesn't wipe what has already been confirmed against it.
Whose time this saves
Employees get a real answer to "what do I need to do to grow" — a list, not the advice to take on more responsibility.
Managers prepare for a promotion conversation in five minutes instead of an evening, because the matrix is already filled in from both sides.
HR can see how levels are distributed across the company and who has had the same target grade for three years running. That's a hard conversation to open without data.
The company applies the same bar to the same roles. It's the cheapest available insurance against arguments about whether promotions are fair.
How it connects to the rest of the portal
Grades don't overlap with 360 reviews and don't replace them: a review answers "how do colleagues see this person now", grades answer "what does the next level require". Current and target grade also appear as columns in the admin employee list, with the same filtering and CSV export as every other field. The whole section can be switched off if your company isn't ready for it, and moved to wherever it belongs in the sidebar.
Getting started
Build one table for your largest role — not all of them at once. A ready structure with levels and filled-in cells can be pulled from the grade library and edited from there. Assign grades to one department, give people a week to run their self-checks, then look at the divergence: that's your first honest reading.
Grades are available on every plan, including the free tier for up to 10 people.