The annual engagement survey works like this: sixty questions in December, a report in February, a slide deck in March. By the time the number reaches the people who could act on it, the company has moved on. And half the answers were guarded anyway, because nobody believed the anonymity promise — the form arrived from a corporate address with a "department" field at the bottom.
Pulse surveys attack both problems. The survey is short and repeats, so what you read is the movement rather than the number. And anonymity isn't a sentence at the top of the form — it's a property of how responses are stored.
Four formats
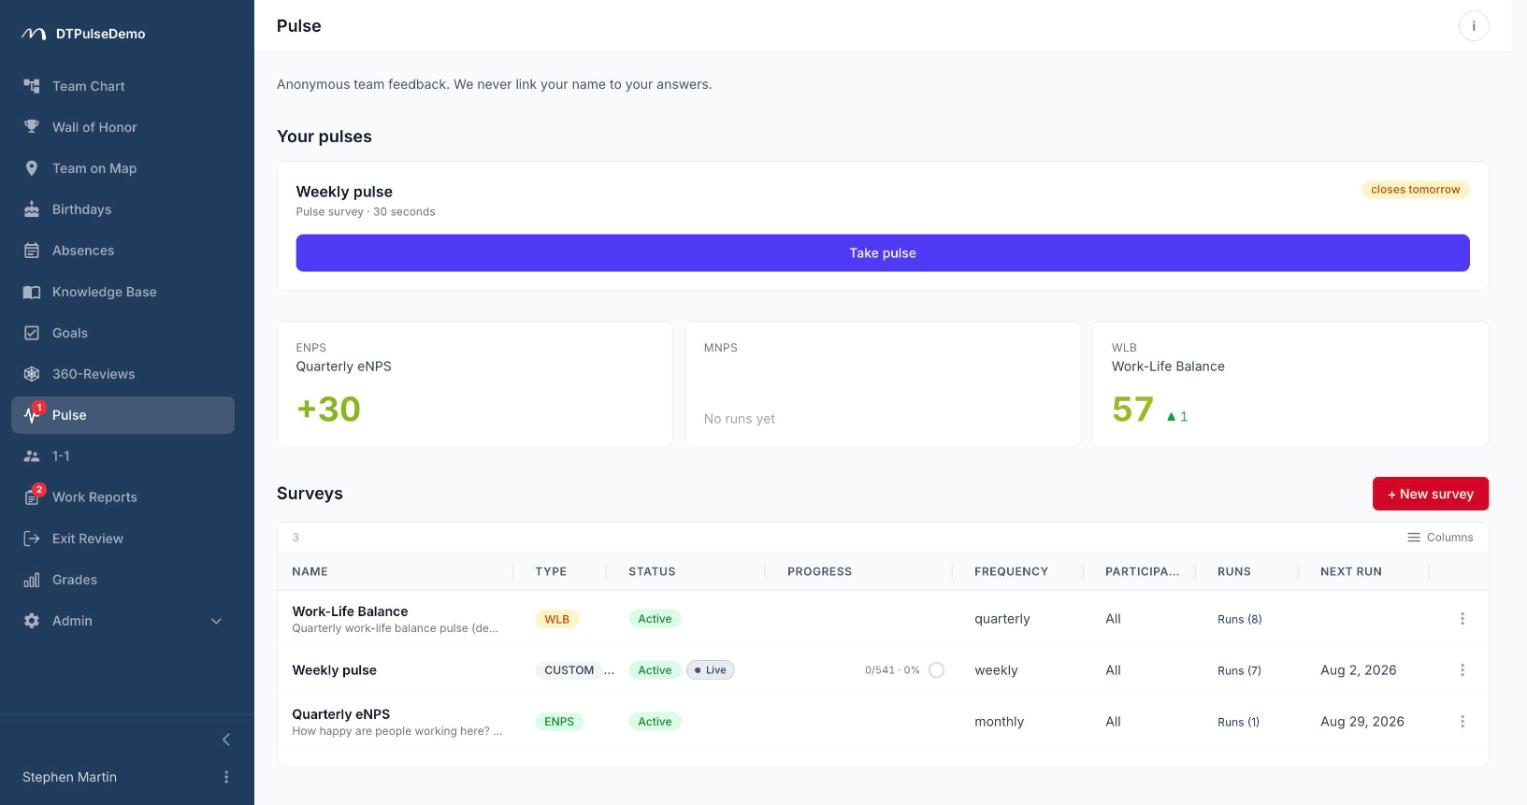
eNPS — "how likely are you to recommend this company as a place to work", on a 0–10 scale. The classic metric, with an optional free-text "anything to add?" attached automatically.
mNPS — the same question about a manager, asked separately for each manager a person has.
Work-life balance — six statements about workload and recovery, rolled into a 0–100 index. Covered in detail on the Wellbeing page.
Custom — one to ten questions of your own: a 0–10 scale, a numeric scale with your own bounds and a description per value, single choice, multiple choice, free text. Choice questions can carry an "Other" option with a write-in box, and any scale answer can ask for a comment — optionally, mandatory only at the extremes of the scale, or mandatory always.
Anonymity you can read off the schema
Invitations and responses are two separate tables. The invitation row knows who it belongs to — otherwise you could neither block a second submission nor remind the people who haven't answered. The response row does not: the employee reference is not hidden in the UI, it does not exist as a column, and the link between a response and a person is impossible at the schema level.
Submission time is rounded down to the hour. Department, manager and tenure are copied onto the invitation when it's issued — a snapshot, not a reference, so someone changing teams six months later doesn't drag their old answers with them and distort the trend.
Any slice of the results appears only when it holds three or more responses. That threshold lives inside the SQL query, not in the interface, so it can't be sidestepped by calling the API directly. Below three you get "not enough responses" — no estimates, no "roughly 7 out of 10". Free-text answers sit behind the same gate.
The honest boundary: the system knows who completed a survey and does not know what they said. Correlating the two is only possible within an hour-wide bucket, and the more people answer in that hour, the less that means.
How the survey reaches people
Three channels run in parallel and independently: a Slack DM whose button opens the form as a native Slack modal, an email with a link, and a page inside the portal listing your outstanding surveys. None of them is a fallback for the others — people answer wherever suits them, and each channel can be switched off in personal settings.
A reminder goes out 24 hours before the survey closes, only to people who haven't answered. Frequency options: once, weekly, biweekly, monthly, quarterly. The response window is 1 to 60 days, a week by default.
mNPS and matrix reporting
The list of managers to rate comes from every channel at once: the direct manager, manually assigned additional managers, and the heads of every department the person belongs to — with the person themselves removed, so nobody rates their own leadership. Each manager gets its own invitation; in Slack that arrives as one message with several buttons.
The invitation set is frozen when a run opens. If someone's reporting line changes the next day, the next run picks it up rather than the current one — otherwise the sample would shift halfway through collection.
What the results show
An NPS index from −100 to 100, sliced by department, by manager and by tenure. The response rate against the number of people invited. Option histograms, free-text answers, and a separate block for write-ins from "Other".
A dedicated page shows every run at once: bars for each run's mean, a line for the running average that damps the noise of small samples. Where a run collected fewer than three answers the line has a gap rather than an invented value.
Whose time this saves
HR gets a recurring feedback channel instead of an annual project. Configure the survey once; it opens itself on schedule after that.
Managers see through mNPS how the team reads their management — before it turns up as a resignation.
Leadership gets a quarter-by-quarter trend instead of a single number in a deck, and slices that show where the softness actually is.
Employees spend a minute answering instead of an hour, and get an answer that genuinely can't be traced back to them.
Getting started
Create one eNPS on a quarterly cadence. The first run opens immediately, invitations go out to every active employee, and results start appearing within the week. Add other formats as the need shows up.
The number of surveys you can keep active at once depends on the plan: 1 on the free tier, 3 on TEAM, 10 on BUSINESS, 50 on ENTERPRISE. Finished surveys don't occupy a slot.